Concrete Skies
and Asphalt Breezes
Unraveling the Urban Weather Phenomenon
Discovering Urban Rain
When Shepherd first started studying satellite rainfall data, he wasn’t interested in urban rain; he just wanted to understand small-scale weather processes along the U.S. Gulf Coast. During the summer, weather tends to be generated by local processes: hot, humid air piles up along the face of a mountain, triggering a thunderstorm; cool moist air blows off a lake, collides with hot air over land, and rain clouds form. Though these and other local processes are still at work at other times of the year, they tend to get swallowed up by large weather fronts that bulldoze their way across a continent, leaving wide swaths of snow or rain in their wake.
It was the local weather-making processes that Shepherd wanted to learn about in 2001 when he started to look at coastal rainfall. NASA, in collaboration with the Japanese space agency, had launched a new satellite late in 1997 that was sending back the best estimates of rainfall in the tropics to date. By early 2001, the satellite had accumulated a three-year record. The record was long enough to begin to reveal year-to-year rainfall patterns. Shepherd was eager to see if the satellite had captured rainfall produced by local-scale events. As he surveyed the satellite data, he was looking for things like rainfall patterns created when a sea breeze interacts with coastal topography, but the pattern he saw emerging from the data of the southern United States surprised him.
The third hypothesis runs along the same lines, but instead of causing the air to pile up, the city divides the air. “Storms that are approaching Atlanta or Baltimore from the west basically split or ‘bifurcate’ around the cities because of the physical structure of the buildings or because of the thermodynamic environment [the urban heat island],” says Shepherd. When the two halves of the storm come back together downwind of the city, the air is pushed up like the two colliding trains. The rising air forms rain clouds.
“I started noticing that around some of the cities, there seemed to be these anomalies in rainfall downwind,” Shepherd recalls. These downwind areas got more rain during the summer than other areas. Having spent his childhood in Atlanta, the idea that his city could be directly affecting the weather intrigued Shepherd. Had anyone else noticed this spike in rainfall? He combed through past studies and discovered that for more than a century, scientists had suspected that cities impact or maybe even create rain. Cities, Shepherd learned, are among the local factors that influence summer weather.
“You need three basic ingredients for clouds and rainfall to develop,” Shepherd explains. “You need for air to be unstable.” Air is unstable when it is warmer than the air that surrounds it. Once the air is lifted, it will continue to rise. That instability usually happens when warm air nearest the Earth is pushed up into the cooler air above it. That leads to the second ingredient: a source of lift. “You need something that will get the air rising, whether that be a cold front, or a mountain, or a sea breeze, or a city.” When surrounded by cooler air, the warm air rises naturally like a hot air balloon. “Three, you need moisture.” If there is enough moisture in the rising, cooling air, the water vapor will condense into clouds and rain. But where does the city enter the process?
The Impact of City Landscapes on Rain
“There’s a debate about how cities affect rainfall,” Shepherd answers. “There are several hypotheses about what is going on, but they primarily involve the urban land use and urban aerosols.” The first hypothesis deals with the urban “heat island” effect. Cities are made of heat-absorbing materials like concrete, steel, and asphalt. Add to that the heat pumped into the atmosphere by the machines that are concentrated in cities and a lack of cooling vegetation, and the temperature goes up. Average temperatures in a city can be as much as six to eight degrees Fahrenheit higher than surrounding rural and suburban landscapes. Called the urban heat island effect, this increased temperature may provide a source of unstable air. If air over a city is warmer than the air surrounding it, it wants to rise. As the city-warmed air rises, it cools and forms rain-producing clouds that soak the area downwind.
Second, cities may be disrupting the flow of air over the Earth’s surface. “If you blow air over a nice pristine wheat field in Kansas, that air at a very low level is going to blow in a straight line,” says Shepherd. But blow that same air over a city, and you get chaos, literally. “Cities tend to have buildings, particularly tall buildings, that cause the air to converge, or pile up,” says Shepherd. “Think of two trains colliding; their front ends go up. That’s convergence.” So the city’s buildings provide a source of lift to push warm, moist, surface air into the cooler air above it, where it can develop into rain clouds.
The third hypothesis runs along the same lines, but instead of causing the air to pile up, the city divides the air. “Storms that are approaching Atlanta or Baltimore from the west basically split or ‘bifurcate’ around the cities because of the physical structure of the buildings or because of the thermodynamic environment [the urban heat island],” says Shepherd. When the two halves of the storm come back together downwind of the city, the air is pushed up like the two colliding trains. The rising air forms rain clouds.
The Impact of Urban Pollution on Rain
Satellites See City Rain
It was with these questions in mind—do cities influence rain and if so how—that Shepherd set out to see what NASA satellite data could contribute. The satellite data he had been looking at when he noticed the apparent urban rain anomaly in the first place were from a satellite called the Tropical Rainfall Measuring Mission (TRMM). Among its suite of instruments, TRMM (which scientists pronounce “trim”) carries the world’s only space-based precipitation radar. Like the radar that you see on the evening weather report, TRMM’s Precipitation Radar bounces radio waves through the atmosphere to measure rainfall. The difference is that all other radar systems are ground-based, and therefore have a limited range, whereas TRMM can observe everywhere between about 40 degrees north and south. When combined with GOES weather satellite and rain-gauge data, the rain data analysis can be extended to even higher latitudes. What’s more, because rainfall is measured with a single instrument, TRMM’s estimates in one city can be compared to estimates from another city, something that is difficult to do with two different ground-based systems.
Pioneering though the instrument is, Shepherd feared that the rainfall data might not be detailed enough to measure the urban rain effect. Each pixel, or data point, that the Precipitation Radar detects measures four kilometers across, and the gridded (combined and mapped) data is even coarser. If the urban rain effect was small, TRMM might not pick up enough data points to detect elevated rainfall totals over and downwind of cities. “But if we could use that satellite data in conjunction with other data sets, then at least we could look at many different cities around the world if we wanted to,” says Shepherd. Spurred by that thought, Shepherd set out to take a careful look at the Precipitation Radar’s rainfall record.
Working with colleagues Harold Pierce and Andrew Negri, both at NASA Goddard, Shepherd focused on five cities in the south-central and southeastern United States that were not near mountains, major rivers, or oceans—features that themselves impact rainfall. “We wanted to try to isolate that the urban environment was the only thing affecting the circulation,” he explains. He divided this area into a grid where each box measured 0.5 degrees by 0.5 degrees (very roughly a 55 by 55 kilometer square) and tabulated the average amount of rain that fell every hour in each box during the summer (May to September). He then averaged the rain rates over the three summers during which TRMM had collected data, 1998 to 2000, and identified where the most rain fell. He found that the amount of rain that fell per hour was as much as 20 percent greater in grids that were downwind of cities than it was in grids upwind of the city. These results were consistent with ground-based studies of the same regions. It seemed that the cities were generating rain and TRMM could measure the effect, but Shepherd wanted a little more confirmation. He set up a series of rain gauges in Atlanta and recorded how much rain fell around the city during a year. He compared those measurements to TRMM’s measurements. The ground and satellite measurements matched: urban rainfall was real, and TRMM could detect it.
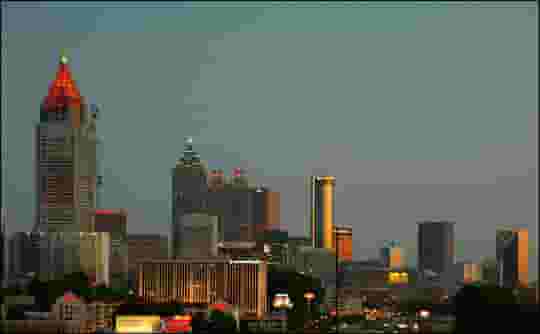
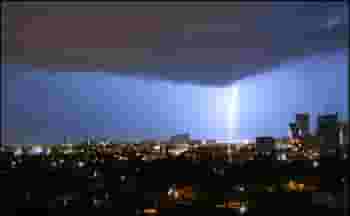 Evening storms frequently strike southern cities in the summer, bringing thunder, lightning, and heavy rain. The confluence of cities and storms may not be a coincidence: more rain falls downwind of some major urban areas than in the surrounding countryside. Satellite measurements and computer models are helping scientists understand why. (Photograph copyright Eugenia y Julian.)
Marshall Shepherd, of the University of Georgia, uses NASA satellites such as the Tropical Rainfall Measuring Mission (TRMM) to study weather and climate. (Photograph courtesy Marshall Shepherd.)
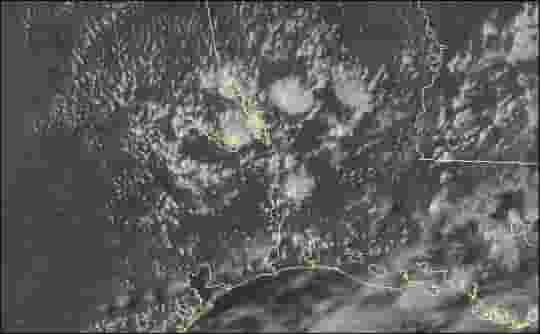 Summer afternoon thunderstorms are a common occurrence near the Gulf Coast. Humid air rising off the hot ground cools as it ascends. The water vapor in the air condenses, and clouds form. These storms sprang up along the border between Texas and Louisiana on September 6, 2006. (Image and animations by Robert Simmon, based on NOAA GOES super rapid-scan data.)
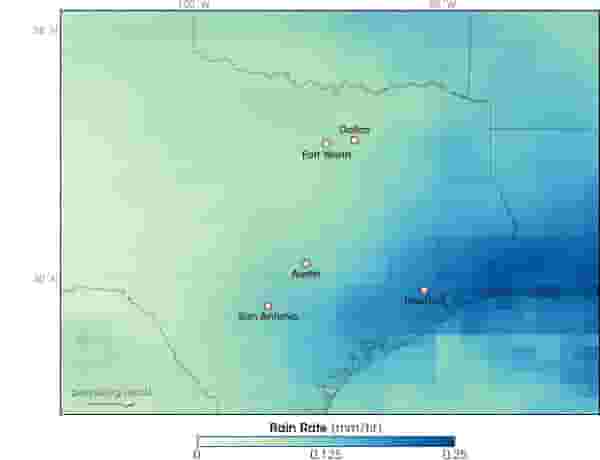 Measurements from TRMM revealed elevated rain rates downwind of urban areas in Texas. Marshall Shepherd noticed the pattern in summer rainfall while exploring the interactions between sea breezes and the urban landscape of Houston. The heaviest rain (blue) occurred downwind of Houston. This image is based on TRMM and rain-gauge measurements during July, August, and September from 1998 through 2006. (Map by Robert Simmon and Jesse Allen, based on Global Precipitation Analysis data.)
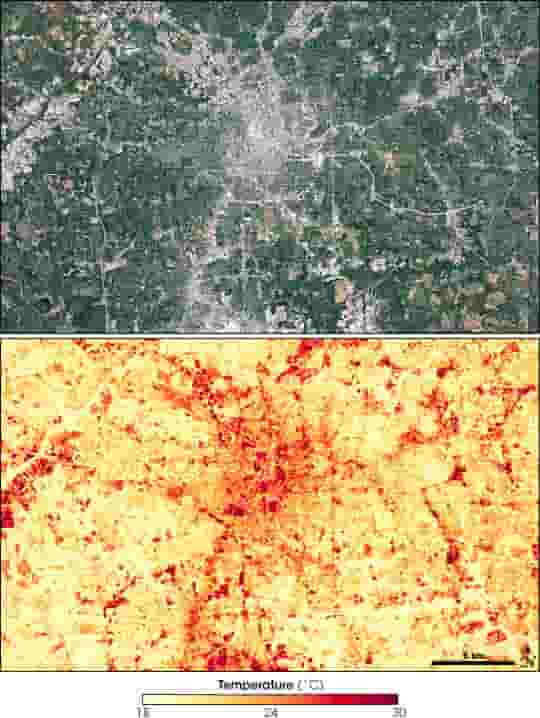 The roofs, concrete, and asphalt of a city absorb heat during mid-day, raising the surface temperature up to 10°C. This pair of satellite images shows Atlanta on September 28, 2000. In the true-color image (top), the urban areas are gray, and wooded suburbs and open fields are green. The map of surface temperature (bottom) shows the urban heat island. Yellow areas are relatively cool, while red areas are hot. (NASA images by Marit Jentoft-Nilsen, based on Landsat-7 data.)
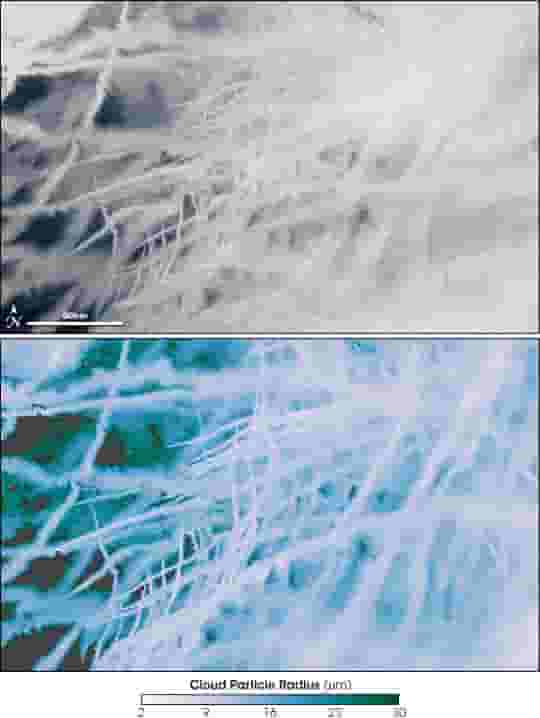 Like urban pollution, the aerosols in ship exhaust change the properties of clouds. These satellite images show clouds over the North Atlantic streaked with ship tracks. The top image is similar to a digital photo, while the bottom image shows the size of cloud droplets from pink (smallest) to green (largest). Compared to droplets formed from naturally occurring aerosols like dust or sea-salt, droplets formed from pollution aerosols are smaller and more numerous. The ship tracks in the image contain droplets as small as 2 micrometers (millionths of a meter), while the clouds in the “background” have droplets that are closer to 20 micrometers. Urban pollution has a similar effect on clouds. (NASA images by Jacques Descloitres, MODIS Land Rapid Response Team, and Mark Gray, MODIS Atmosphere Science Team.)
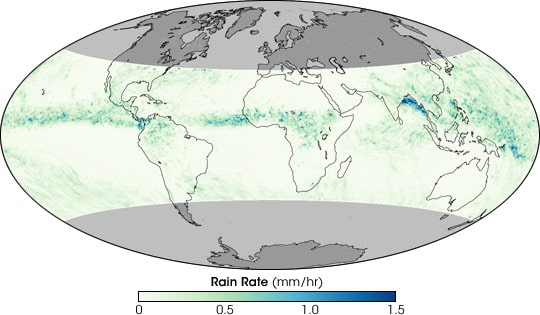 The Tropical Rainfall Measuring Mission (TRMM) monitors rainfall 40° north and south of the equator, far enough north to examine cities in the southern United States. This map shows TRMM observations of average hourly rainfall rates in August 2006. Highest rainfall rates (greens and blues) occur across the Tropics. (NASA image by Robert Simmon, based on TRMM data.)
 TRMM’s Precipitation Radar maps rainfall in three dimensions along a narrow path underneath the satellite. The radar scans the storm in both the along-track (in the direction the satellite is moving, upper inset) and cross-track (across the width of the swath, lower inset). Other TRMM sensors provide visible and infrared data on the storm. Shepherd and his colleagues used these data to help understand the influence of cities on rainfall. (NASA image by Robert Simmon, based on TRMM data.)